
Introduction
In Grand Theft Auto V you can rob convenience stores, gas stations, and liquor stores by either holding the clerk up or murdering the clerk and taking the money out of the register yourself. Usually when performing a robbery, I would just murder the clerk and take the money out of the register myself, but one day I did the full holdup and got more than I usually would. I did a few more holdups, and each time got what seemed like a lot more money than a usual murder. So I decided to do a statistics experiment on whether murders or holdups gave a higher payout per robbery.
Methods
First we must define the two styles of robberies, murders and holdups. A murder is defined as where you run into the store and shoot the clerk, go behind the register and take the money out of the register. A holdup is defined as going into a store, pulling out a weapon, and letting the clerk take the money out of the register and throwing a bag of cash over the counter to the player. There was a situation where in a holdup and an NPC customer in the store, and pointing the gun at the customer made the clerk run to the back room, these were counted as murders as the player had to take the money out of the register. Players can also speed up the time it takes the clerk to empty the register into the bag by shooting weapons inside the store around the clerk, this is considered intimidation acceleration.
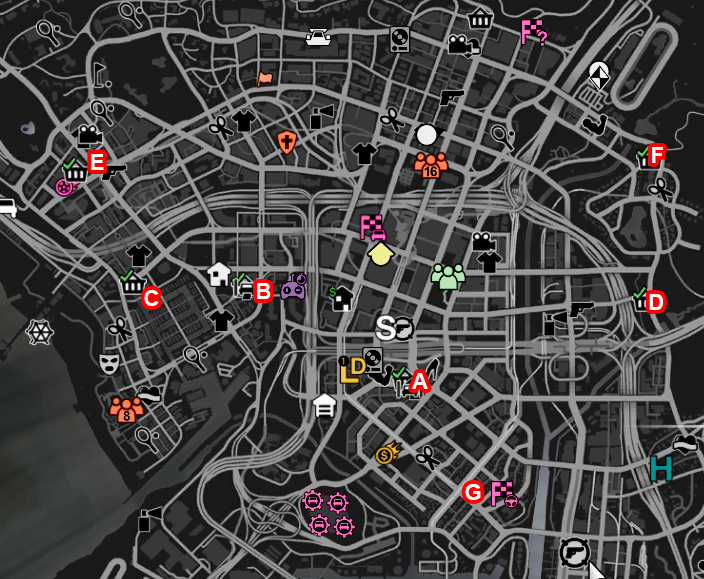
There were seven stores used in the study, and can be seen on the attached map with a letter designation, white text with a red outline. A, B, F, and G are considered gas stations, and C, D, and E are considered liquor stores. These stores were chosen as they are centrally located downtown, and I could race in my car back to the subway where it goes underground to get away from the cops.
Robberies recorded using a Google Form with the form fields of store, holdup type, and payout amount. Two players contributed to the data, myself, and another redditor whom I do not know their username, but someone I know in real life. Data was downloaded from a Google Sheet that the form was feeding into, the download format was .csv, and data processed in R Stats. Robberies were conducted with GTA V Online, neither data collector uses mods. The sample count at the end was 100 samples, 50 holdups, 50 murders.
After some preliminary checks with a smaller sample size while building this dataset I decided to record the amount of money in each handful of cash taken out of the register during a murder robbery. It is difficult to record each reading of money taken out of the register when it happens four or five times in a matter of seconds, to overcome this difficulty I mapped a screen capture key to a mouse button as handful is on screen. The screen captures were then recorded in another Google Sheet as a separate dataset. The number of handfuls of cash samples recorded was 130.
Results and Discussion
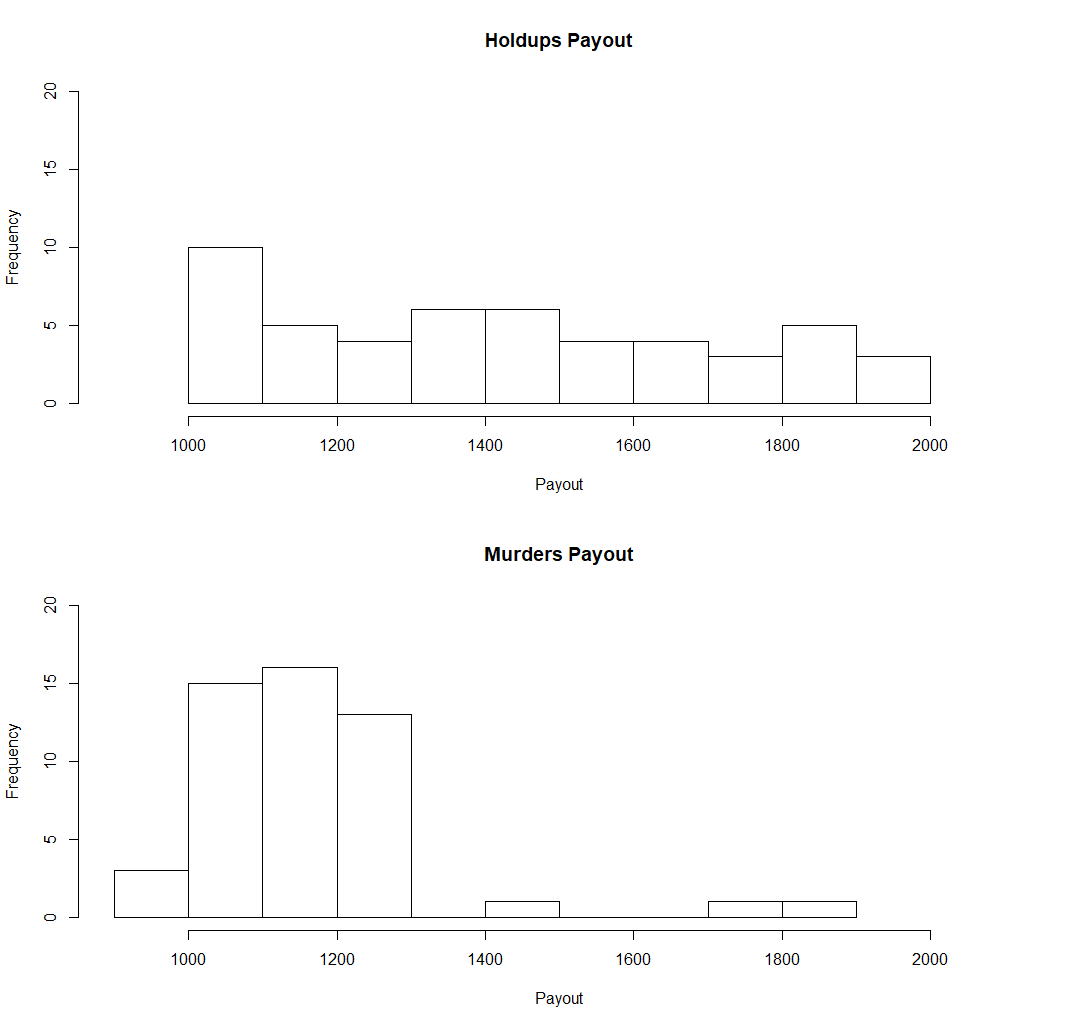
To start off we need to look at the overall differences in holdup versus murder robberies, which as my hypothesis of holdups giving a higher payout than murder robberies, we can use a T Test to figure out if there is a significant difference. The T Test for holdups versus murders rejects the null hypothesis that they are the same with a p-value of 2.8×10⁻⁶. Box plots and violin plots show off the differences between the data quite nicely and are shown as figure 1. As you can seen in figure 1, they obviously have a different distribution, the murders pay out less money with two outliers, and the holdups payout a wider range. Looking at the histogram of the two robbery types in figure 2 also confirms this with how murders have a right tail distribution, and holdups have a more even distribution with the 1000-1100 range having a slightly more readings.
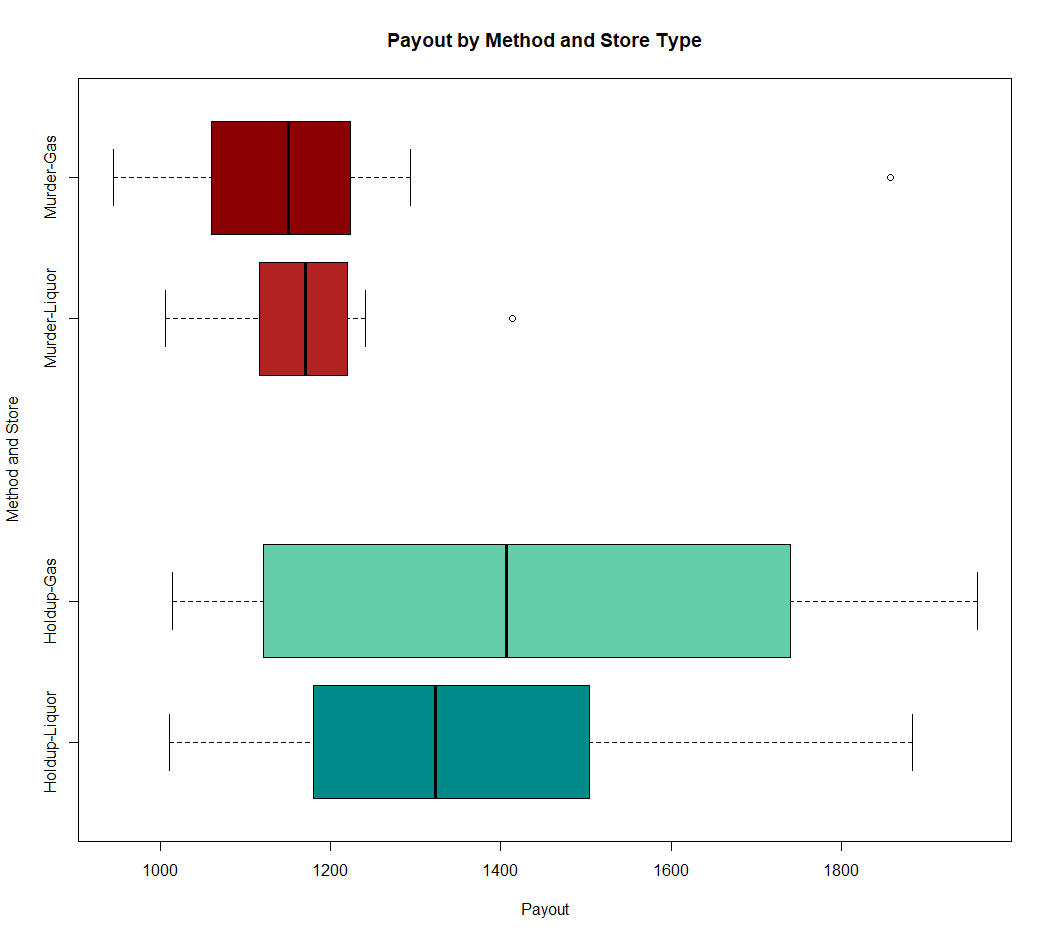
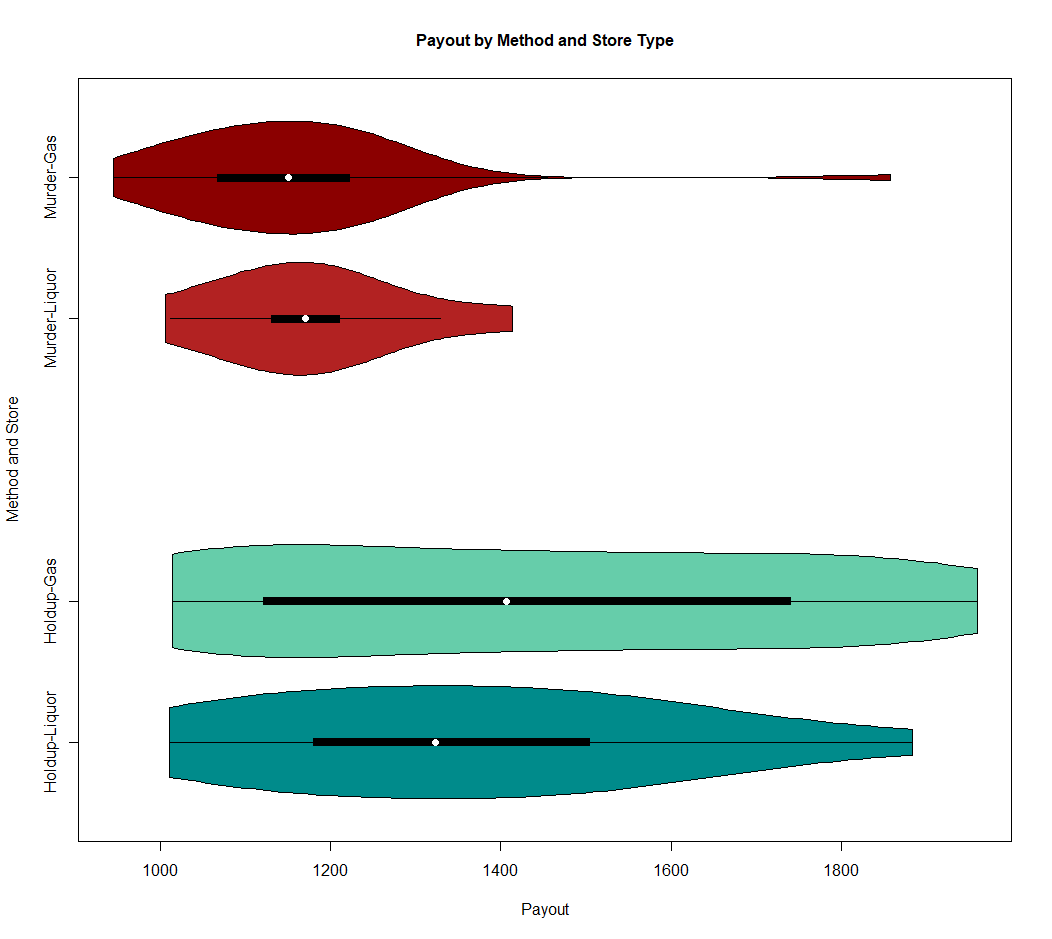
Next we should look at the payouts by store type, which I offered no initial hypothesis for, but we can again use a T Test to figure out if the data are significantly different. As we have already determined that holdup pays out at a wider range than murders, we should test the difference in stores by the method. With holdups at gas stations (n=35) and holdups at liquor stores (n=15), we cannot reject the null hypothesis that the data are the same with a p-value of 0.3593. The same can be found for the murders at each type of store, gas stations (n=38) and liquor stores (n=8), we reject the null hypothesis with a p-value of 0.6613. The similarities in distributions can also be seen in the box plots and violin plots in figure 3, the violin plots shows each have a similar distribution and, although the holdups at liquor stores seems to have a slight taper off a the higher end of payouts, this could be due to the difference in the number of samples between each type of store.
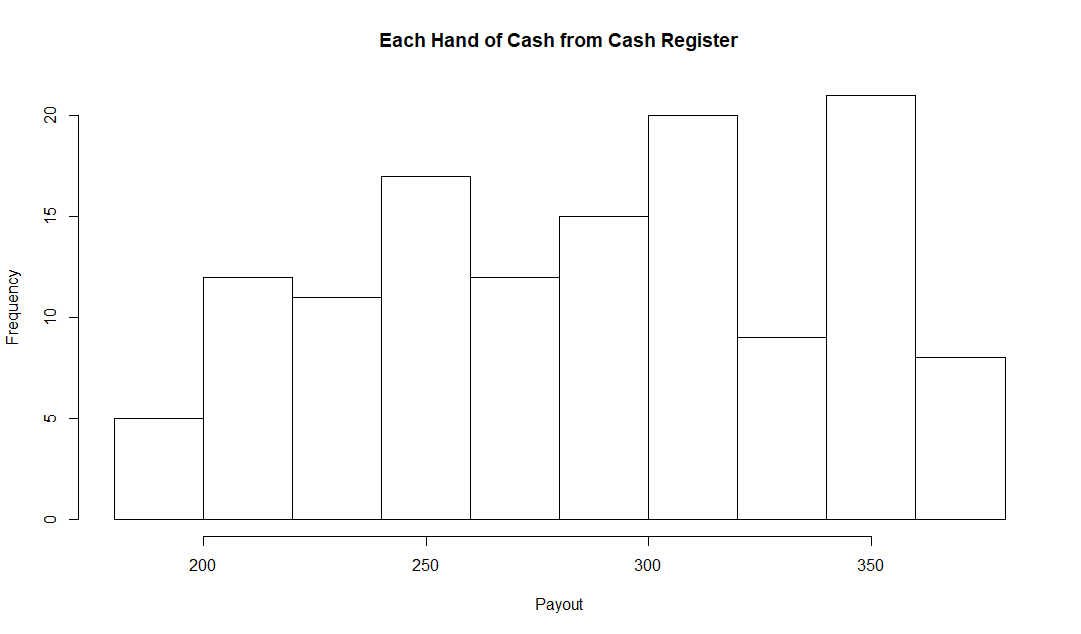
The mechanism of the murders payout where the player takes the money out of the register is four instances of a random number. The outliers as seen in figure 1 appear to be this mechanism but there is a fifth hand in the register. As this, and really everything about this project, is based on a random number generator, lets take a look at the skewness and kurtosis of the data. The kurtosis of the hands of cash data is 1.911, indicating that we have a platykurtic distribution, so not a lot of peaking at any end. The skewness is -0.159, indicating a moderately left tail skewed dataset. You can see the histogram of the hands of cash data in figure 4, and the hands of cash box plot and violin plot in figure 5.
Conclusions
If you are going to be robbing stores in Grand Theft Auto V, holding up the clerk has a higher range of payouts than murdering the clerk and taking the money out yourself. There are some instances where you might get lucky and get a fifth handful of money, which will give you a payout closer to the higher end of the holdup range.